Today we are excited to announce the first release of tusks.io. This release includes everything necessary to measure and analyze the performance of your production.
Our first release includes everything to get useful Key Performance Indicators (KPIs) from your production. More releases will follow every quarter. In the meantime, we will continuously provide updates and bug fixes. Because tusks.io is a cloud service, all updates and releases are automatically deployed to your account. Therefore, you do not need to hassle with upgrades or downtimes. We will announce software changes in this blog.
Tusks.io is developed by Tillner GmbH in Switzerland.
In this release, we developed many features to achieve our goal of providing you with all capabilities to analyze your production. In the following, we will present these functional features. Besides this, our software comes with plenty of non-functional features such as responsibility. So you can use them on any devices such as Workstations, Tablets, or Smartphones. Everything is cloud-based and just runs. You do not need to set up servers, bother with network settings, or update individual devices. You can use it from any place with an internet connection, e.g., on the shop floor, your office, or your home. Tusks.io is available in five languages.
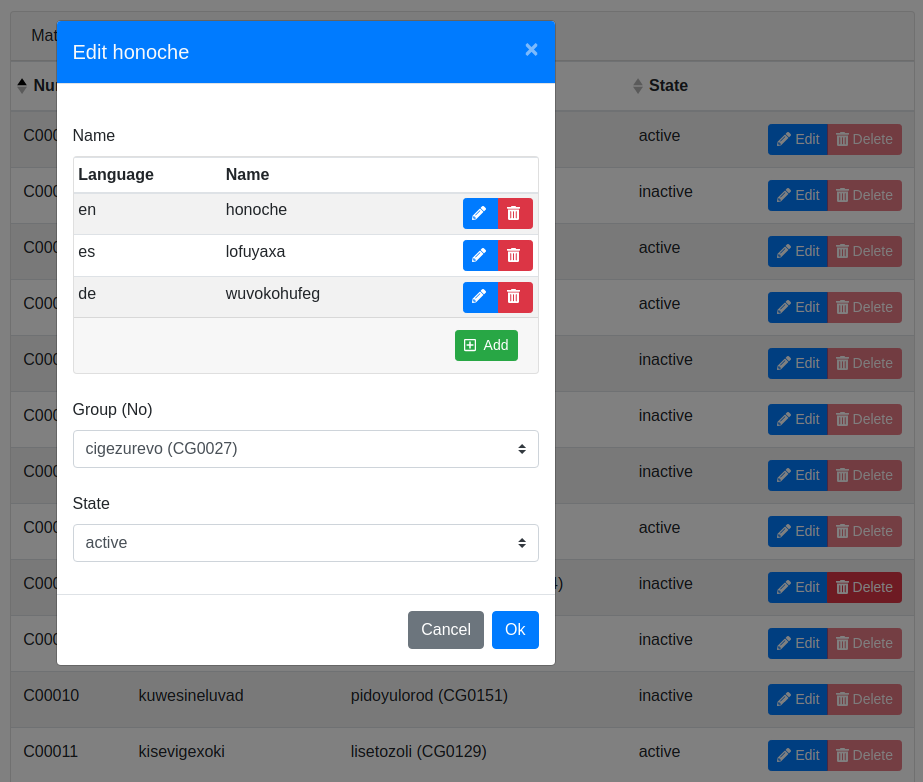 Material edit dialog with material table in the background.
Materials are a fundamental part of master data. Therefore, you can organize and use them by material groups. It is also possible to have multiple languages for your material names. Materials are used in production orders as material that is produced as well as consumption components.
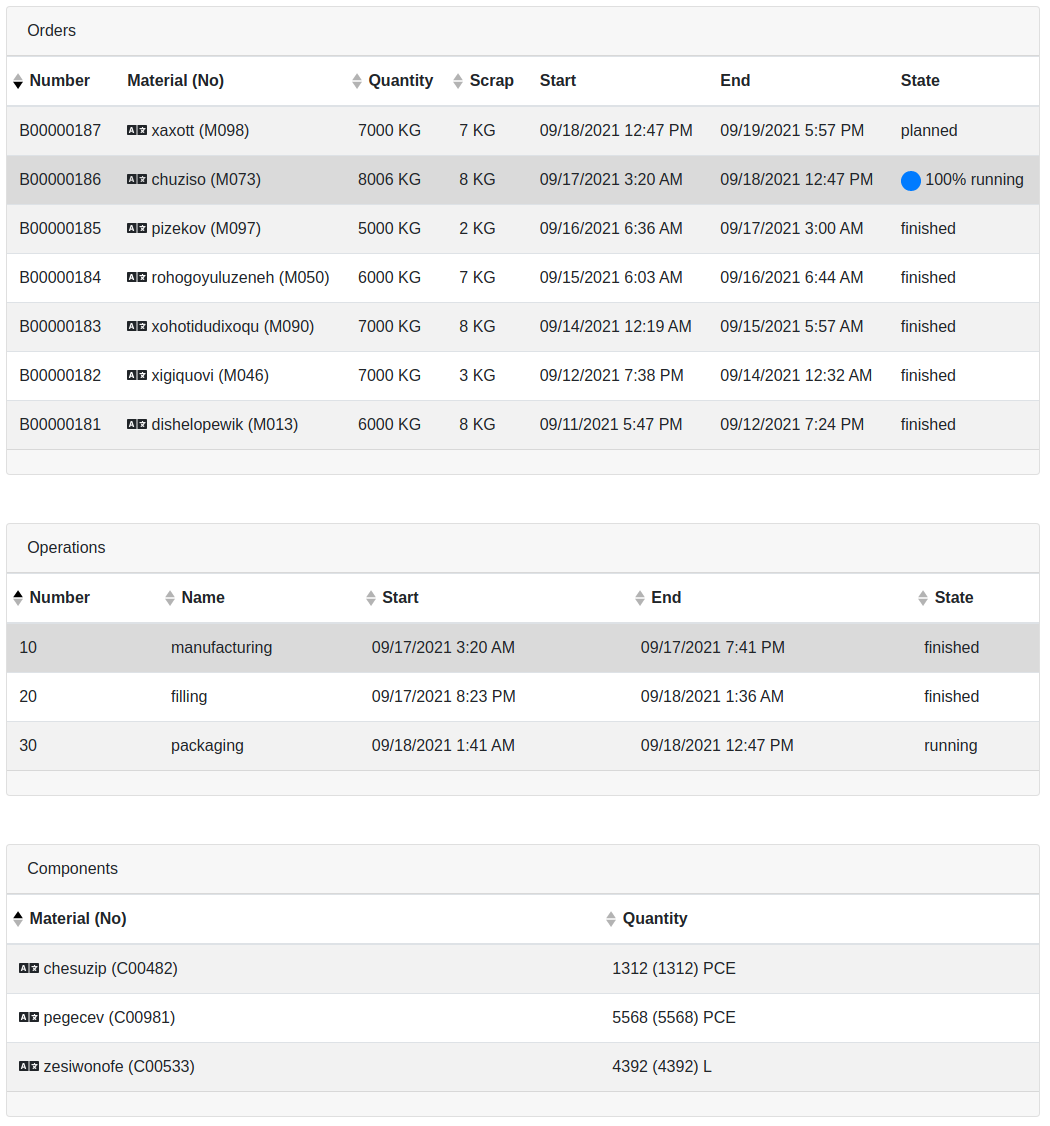 Order table with operations and components.
An essential part of our system are production orders. A production order consists of operations and consumption components. We distinguish times and quantities between planned and actual data.
You can create orders entirely manually by specifying all data. Another option is to use recipes and only set the quantity and start time of the order.
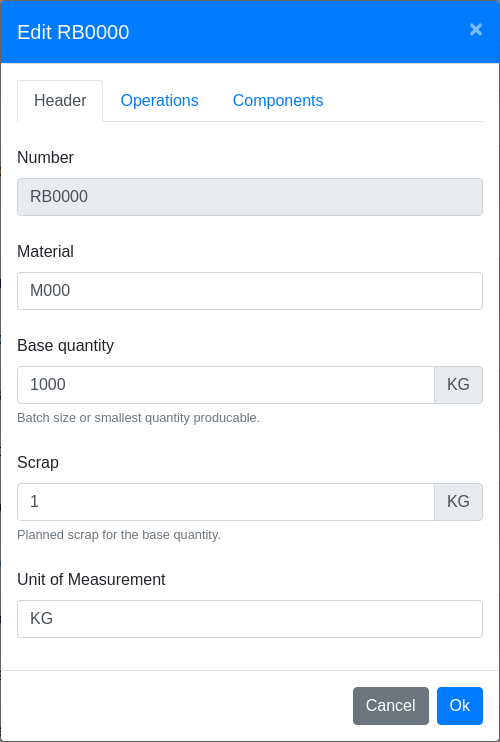 Recipe edit dialog.
Recipes are a template for production orders. With a recipe, you can predefine information necessary for an order, e.g., base quantity, expected scrap, operations, and components. Then, when creating an order from a recipe, this base information is automatically applied to the desired order amount.
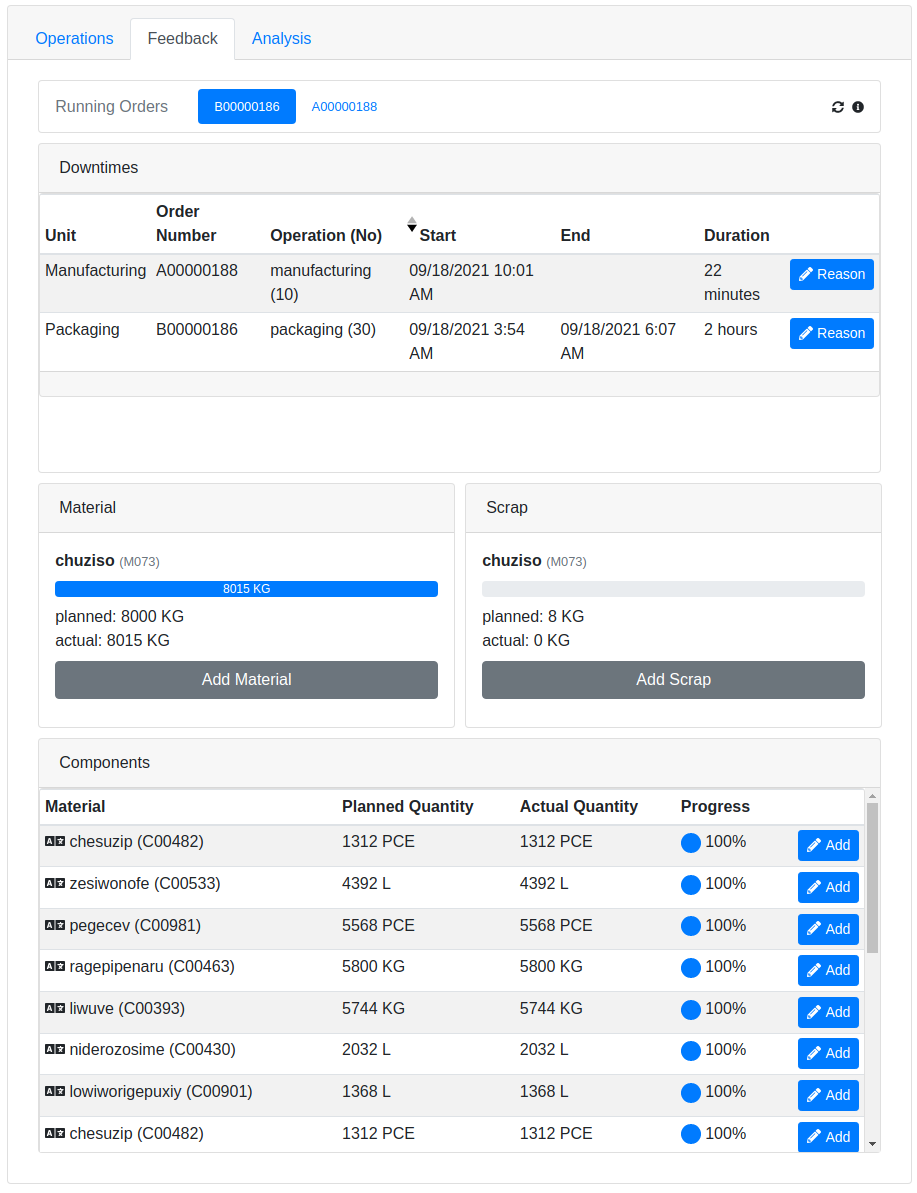 Example of an individual configured dashboard for manual data collection.
Dashboards present you information about your production or give you the possibility to manually change data. It is possible to configure multiple dashboards for different tasks. E.g., you can have a dashboard to provide you with a quick overview of the production state. You could show a dashboard on a big screen on the shop floor. You could use another dashboard to show important figures and performance indicators. With individual permissions applied to every dashboard, this one could only be visible for production management.
A dashboard consists of widgets. There are a dozen different widgets from different categories. All widgets can be sized and placed individually on a dashboard.
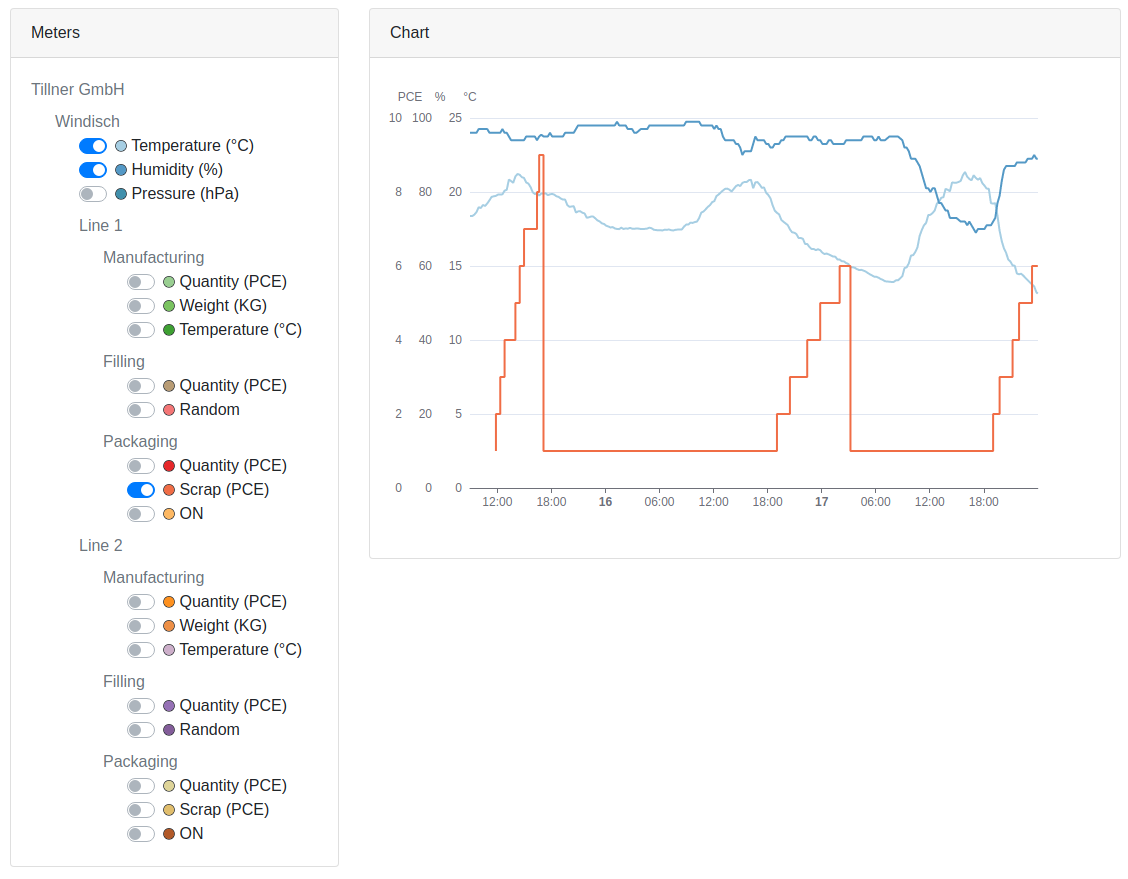 Plot of meter data over time and corresponding unit of measurements.
Meters are an easy way to plot your meter and sensor data over time.
This data is typically pressures, temperatures, voltages, and similar. But it can also be counters of good scrap and rework quantities. You can assign these quantities from meter data directly with your order data.
You can plot meter data of a specific period, per order, per material, or shift. Furthermore, all data of different meters can be plotted together in the same chart. We use the latest technology to render your time series data blazing fast.
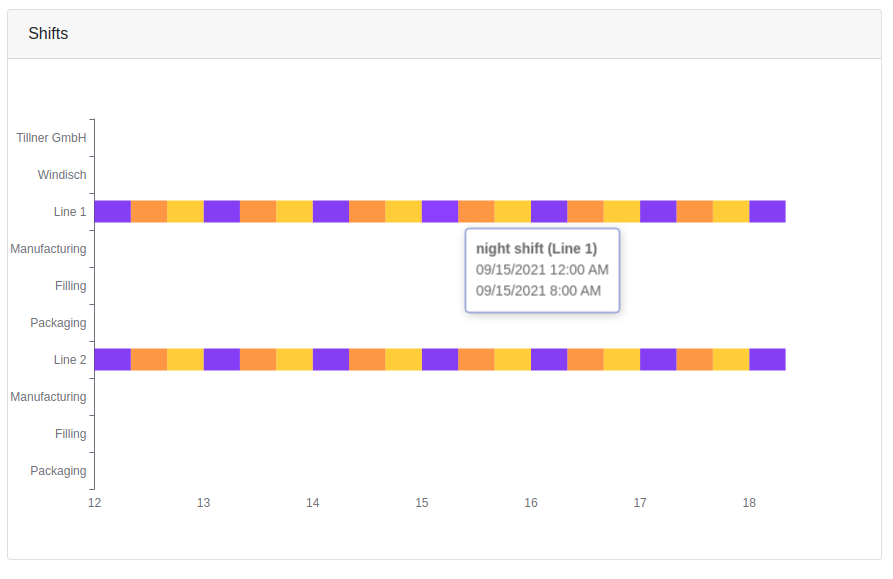 Timeline view of recorded shifts.
Save your shift model as master data and capture your shift changes with only a few clicks. With your recorded shifts, you gain the ability to compare meter data, KPIs, and more by shift. Save a message when changing shifts to get an uncomplicated and documented shift change.
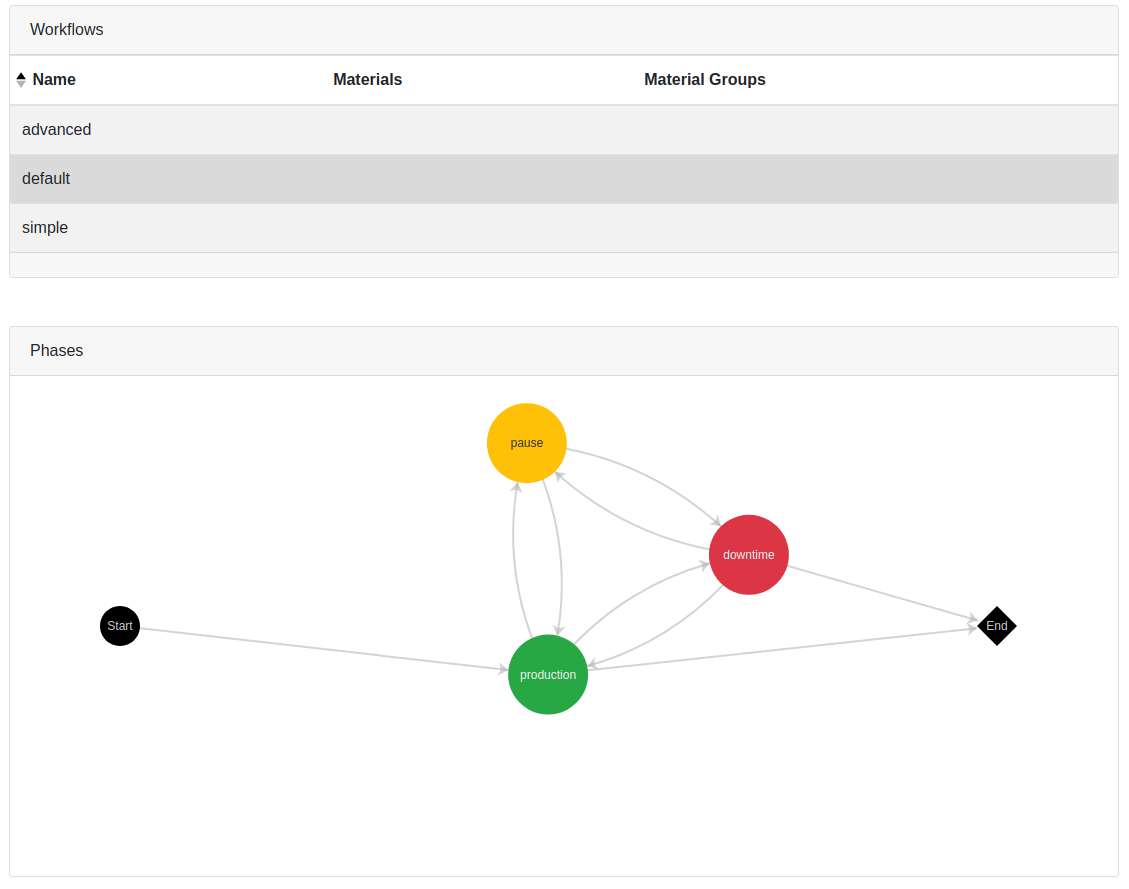 Workflow with phases and transitions.
With workflows, you model your specific production process. This way, you can capture times of the production phases like equip phase, downtime, pause, or whatever your production uses. Then, based on these phases, we build live KPIs for you.
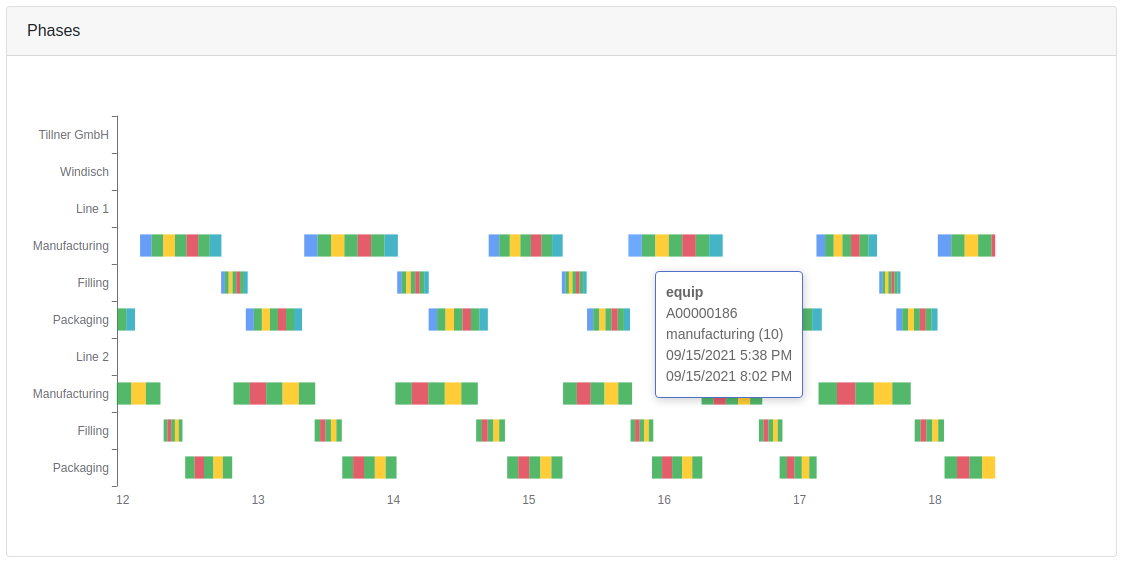 Timeline view of recorded phases.
You can see your production phases in a timeline overview. So you get an easy tool at hand to identify problems or just see what is going on.
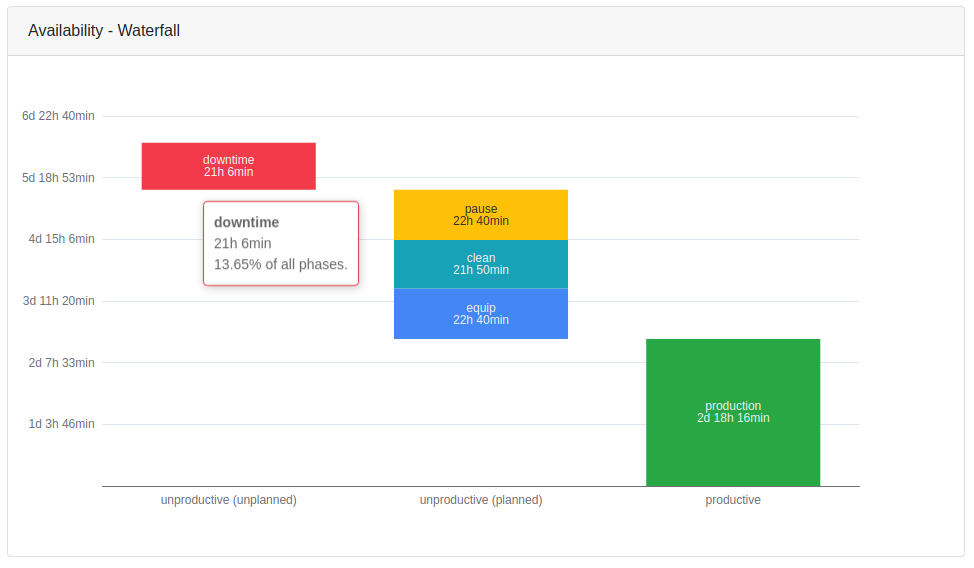 Availability chart showing the workflow phases assigned to their availability type.
Based on your production phases and recorded quantities, we build diverse KPIs. The probably most important tool to analyze your production is the Overall Equipment Efficiency (OEE). We offer more detailed KPIs for availability, performance, and quality based on the OEE. With our real-time KPI charts, you get an instant insight into what is happening on your shop floor.
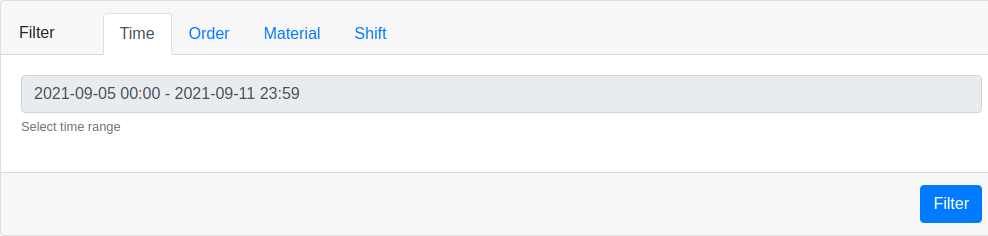 Time filter
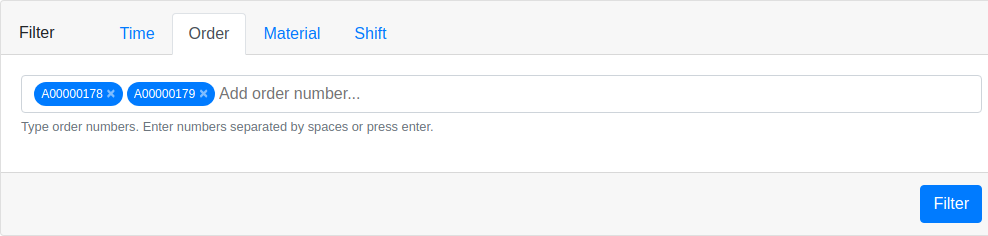 Order filter
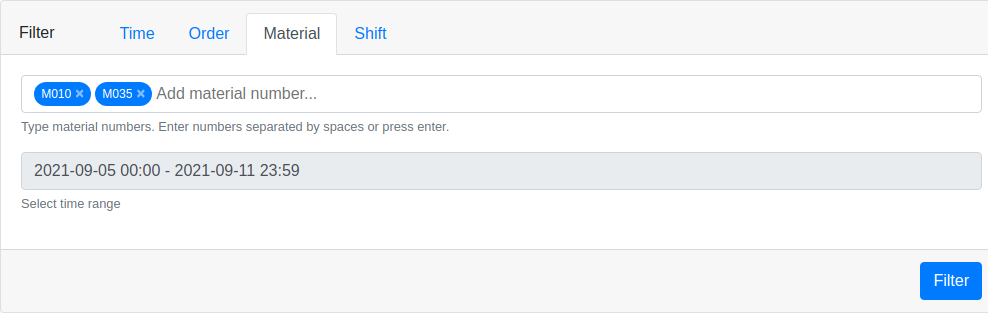 Material filter
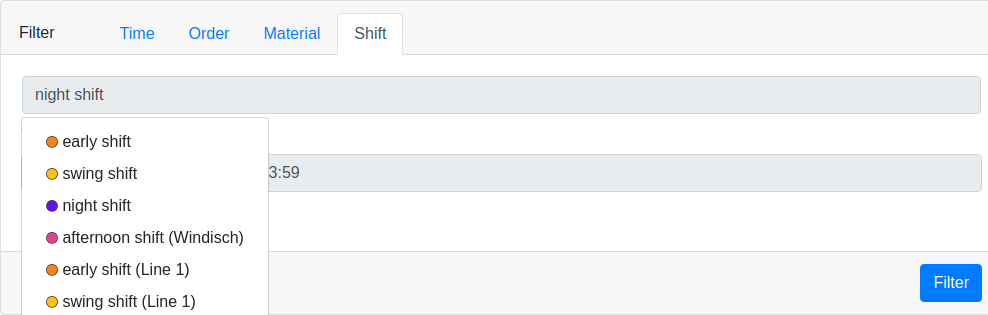 Shift filter
A powerful filter makes it very easy to handle tons of time-based data. For example, meter data, orders, shifts, production phases, and so on can be filtered by time, order, material, or shift.
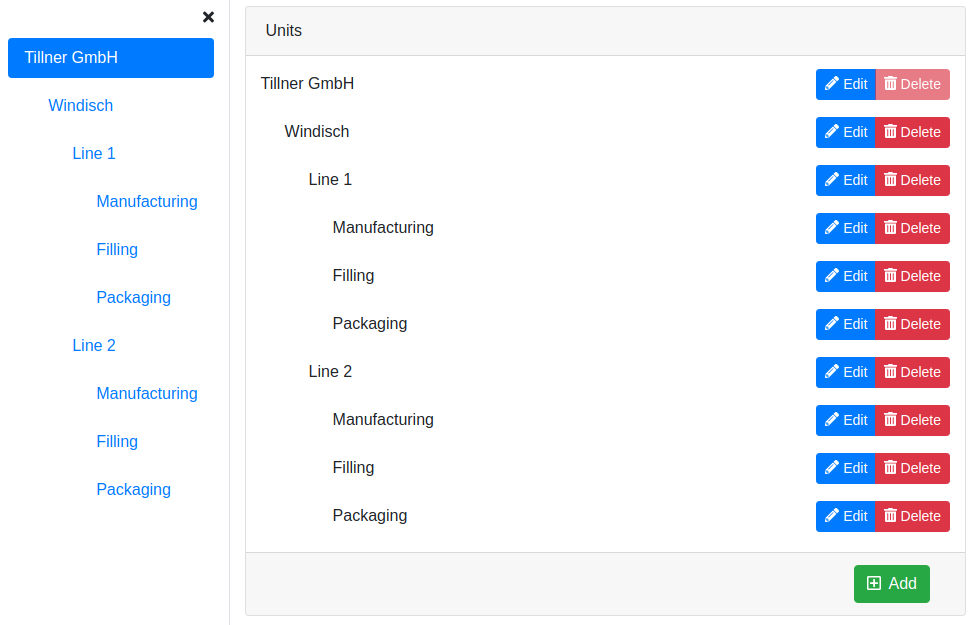 Configuration page for organizational units and unit menu to the left.
Map your company structure from factory sites to production lines and machines. All your data depends on your organizational units. So it is possible to filter your orders, KPIs, etc. with the units menu. Higher units will aggregate data from their child units. So it is possible to capture data on the machine level and analyze a summary on the company level. It is easily possible to compare your meter data on different production lines by selecting their parent unit.
It is easy to add or delete organizational units when things change. You can rename units, sort them to fit your production process, and set an individual icon (to identify them quickly) in the configuration dialog.
You can set user permissions on individual units. So employees can only see production lines or machines they are working on.
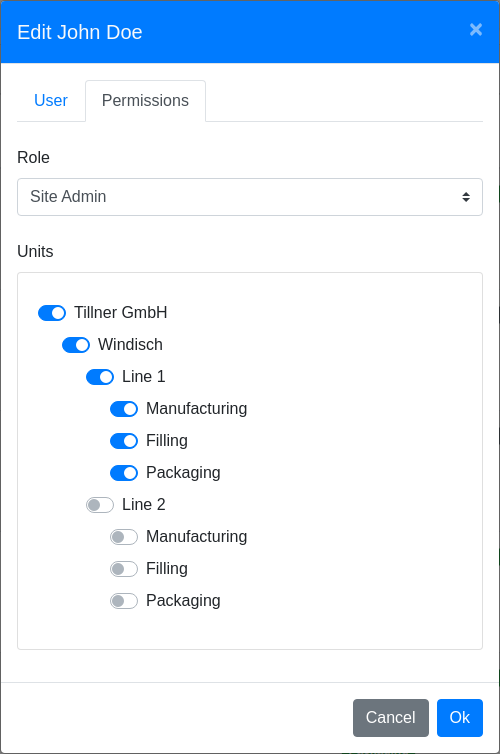 Configuration dialog for user permissions.
We provide a rights management model to set permissions for roles and users. For example, you can set access to menu items (such as orders, KPIs, meters, etc.) and dashboards with roles. In addition, a user gets access to organizational units.
There are no limits on the number of users or roles.
It is possible to run the whole system standalone. Standalone means there is no need to integrate other systems like ERP or machines. Nevertheless, to reduce work and duplicate data, it is usefull to integrate into existing systems. We build an intuitive API that supports token-based authentication and uses an encrypted connection. We recommend using node-red for your integration needs. We will provide an easy way to connect common systems such as SAP ERP and Siemens PLCs. More on this topic will follow in the coming weeks.
More articles about using tusks.io, integration of third-party systems, and general topics relevant to manufacturing will be available regularly.
If you have any questions, please don't hesitate to contact our support.