
The MES for your shop floor. As a service.

tusks.io is a cloud-based manufacturing execution system. Orders, machine data, quality and maintenance come together on one web-based platform. You see what is happening in production in real time, without servers and without an IT project.

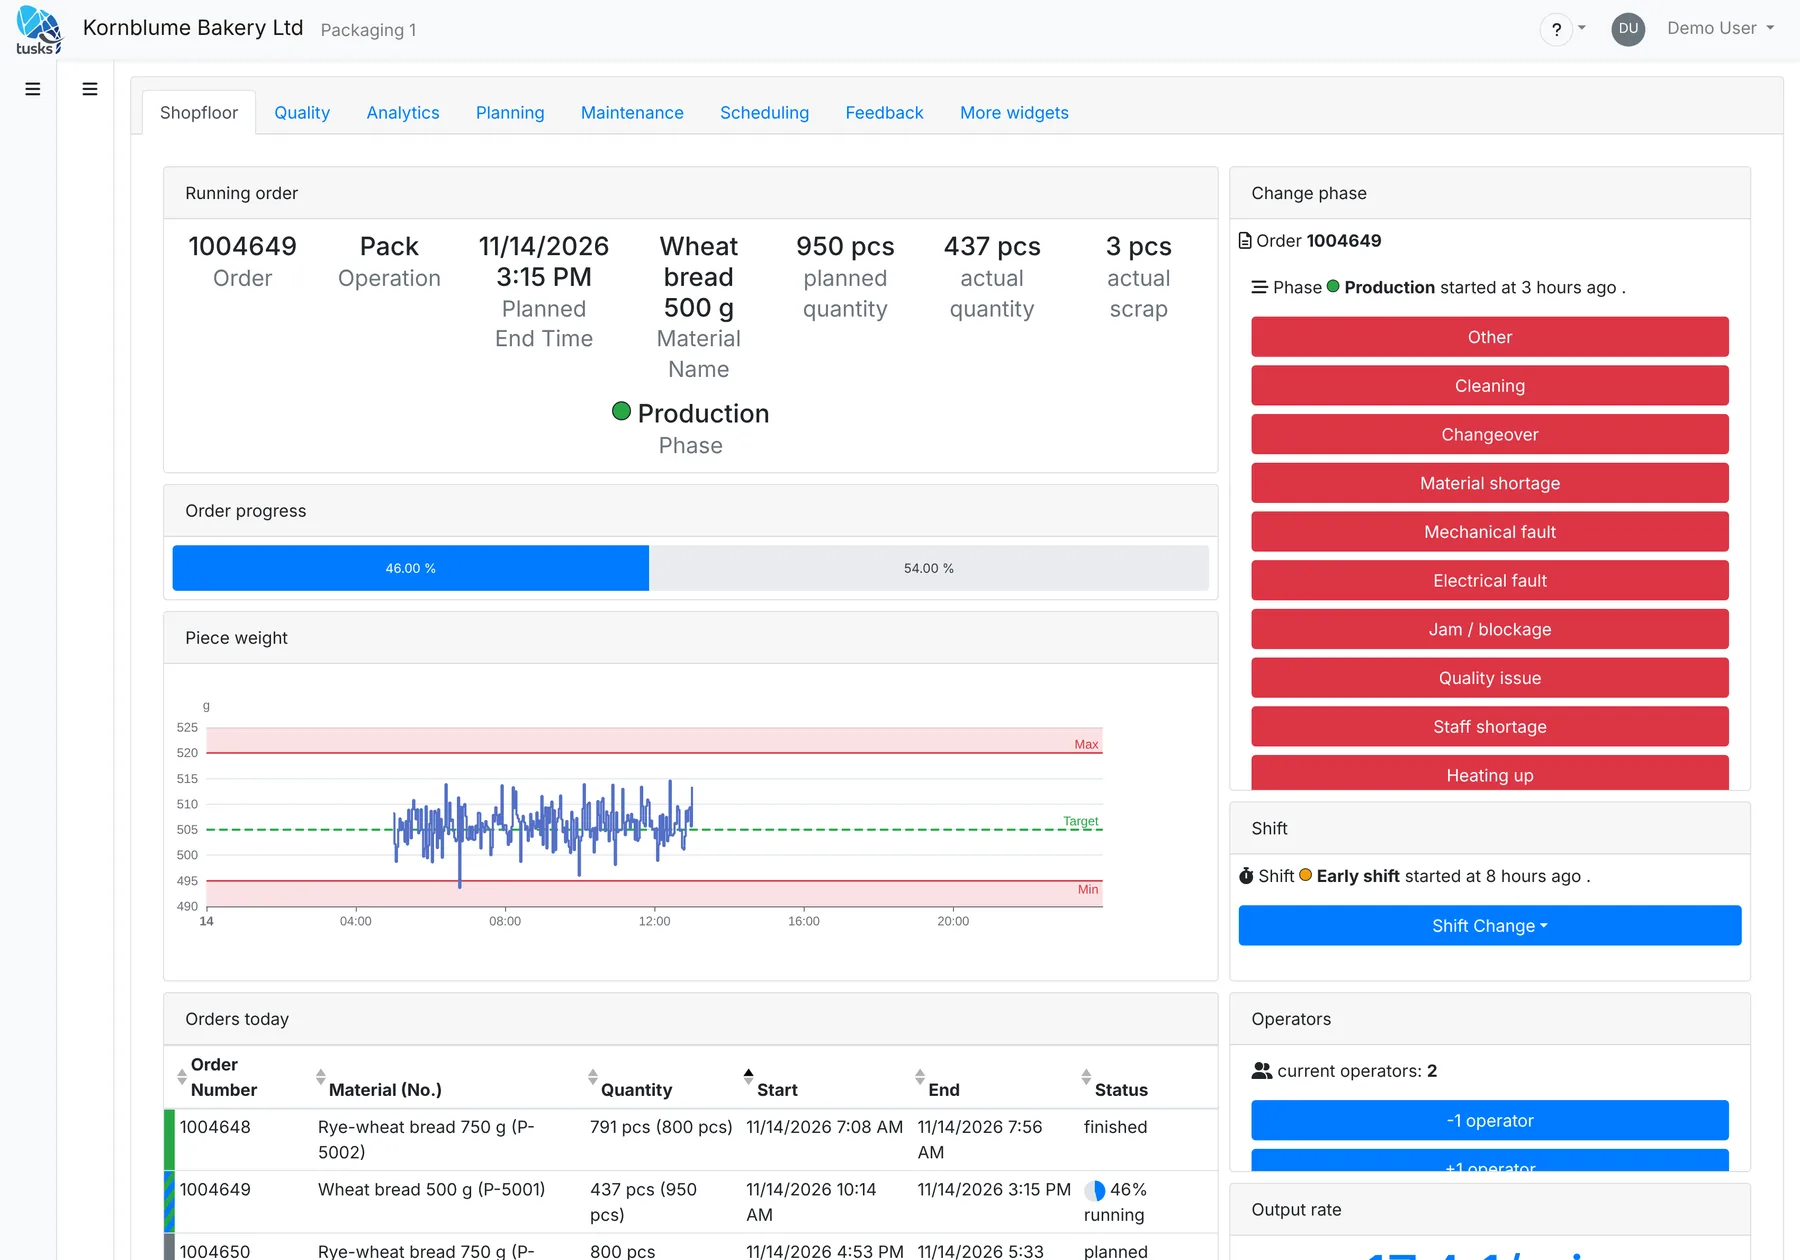
tusks.io shop floor dashboard: running order, order progress, piece weight with limits, phase change and due inspections
One shift on one line, as tusks.io records it: ProductionChangeoverFaultBreak

See how tusks.io improves your manufacturing process

The software connects your production operations with real-time data, material flow and quality control. Every department works from the same numbers.

Find bottlenecks

Downtime, scrap and performance losses show up per order, line and shift while they happen.

Plan resources better

Orders, maintenance and shifts share one timeline. Replanning is drag and drop.

Decide with confidence

KPIs such as OEE, first pass yield and scrap rate come from recorded data, not from spreadsheets.

Features

All images show the application with the data of our demo plant, an industrial bakery with three lines.

Shop floor dashboards for every line

Every line and every machine gets its own dashboard, usable on a tablet, a terminal or the screen on the wall. Operators see the running order, report quantities and change the phase with one tap.

  • Running order with planned and actual quantity
  • Downtime reasons at the push of a button: changeover, cleaning, fault, material shortage
  • Shift change, staffing and cycle rate at a glance
  • Due inspections right at the workstation
The dashboard of the “Packaging 1” station: running order, progress, piece weight with target and limits, buttons for changing the phase and the list of due inspections.
VideoThe feedback wizard walks through the components of an operation step by step. Pick the batch, enter the quantity, continue.

Planning and detailed scheduling

The timeline shows all orders and maintenance tasks across lines and machines. You create new orders manually or from a recipe. When things change, you move orders with the mouse and tusks.io recalculates the times of that day.

  • Timeline across all organisation units
  • Create orders from recipes
  • Maintenance tasks in the same plan
  • Drag-and-drop replanning with automatic recalculation
Planning dashboard: timeline of all lines, buttons for creating orders and maintenance tasks, and below it the planning board for the coming days.
The order overview as a timeline. Each row is a machine; times without a shift are shaded grey.
VideoOrders and maintenance tasks are moved on the planning board. The times of all items of that day are recalculated.

Orders, recipes and traceability

Recipes describe which operations, materials and quantities a product needs. They become orders whose progress, scrap and rework are recorded continuously. Traceability shows which batches went into which product.

  • Recipes with operations, components and products
  • Batches with best-before date and remaining quantity
  • Traceability from raw material to finished product
  • Create new products right from the dashboard
Traceability of one order: the flow diagram shows which raw material batches passed through kneading, baking and packing into the finished product.
Recipes with base quantity, expected scrap and rework. Below, the operations of the selected recipe with duration and staffing.
VideoA new product is created: material number, names in several languages, material groups and properties.

Quality and inspections

Inspection plans define what is checked when and on which machine. Open and overdue inspections appear where they have to be done. The results feed the quality KPIs.

  • Inspection plans with characteristics, expected values and schedule
  • Open, passed, failed and overdue inspections
  • First pass yield, first time yield, scrap and rework rate
  • Distribution of measured values as a histogram
Quality dashboard: KPIs of the week, open and failed inspections, the distribution of the fill weight, and dough temperature and piece weight over time.
All inspections of a period with order, operation, due date and result.

Meters and process data

Temperatures, weights, counters or power consumption: tusks.io stores measurements as time series and shows them with limits and targets. Data arrives from your controllers through the API or Node-RED, or is entered by hand.

  • Time series per machine and meter
  • Limits and targets right in the chart
  • Filter by period, order, material or shift
On the left the meters per machine, on the right the selected time series with their limits, here the oven temperature across several batches.

KPIs and OEE

From phases, quantities and scrap tusks.io calculates availability, performance and quality, and from these the overall equipment effectiveness (OEE). You see where the losses occur, from the whole plant down to a single machine.

  • OEE with a calculation you can follow
  • Losses by availability, performance and quality
  • Downtime reasons, repair times and performance by order, material and time
  • Every level: company, plant, line, machine
Analytics dashboard: availability, scrap, downtime and run time of the week, below it OEE and availability per operation, power consumption and oven temperatures.
The OEE page shows the losses as a waterfall and, below, the calculation with all times and quantities.
Availability analysis: the waterfall splits the week into unplanned downtime, planned downtime and productive time. Below, the downtimes by reason, sorted by duration.
When do which downtimes occur? The punchcard shows reasons by weekday, the scatter plot frequency against duration, and below the mean time to repair (MTTR) per reason.
Performance analysis: pieces per minute for each order and each material, with the average as a line.

Maintenance

Maintenance tasks are planned, started and finished like orders. A recorded downtime becomes a maintenance task with one click. The parts structure shows which components are installed in which machine.

  • Planned and unplanned downtime as KPIs
  • Create maintenance tasks from downtimes
  • Recurring tasks such as the weekly deep cleaning
  • Parts and spare parts as a table or tree
Maintenance dashboard: downtime KPIs, the maintenance tasks of the week and the downtimes with their reasons.
The parts of one line as a tree, from the line through the machine to the single component.

Customising and integration

You assemble dashboards from widgets yourself, for every role and every organisation unit. tusks.io runs on its own and needs no integration. If you want to connect machines or your ERP, you do so through the API and Node-RED.

  • Dashboard editor with widgets for KPIs, tables, forms and documents
  • Roles with permissions for navigation, dashboards and Node-RED
  • Workflows and downtime reasons you define yourself
  • Language per user: English, German, French, Italian, Spanish
  • Connects to ERP (e.g. SAP), PLCs and control systems
VideoA new dashboard is built: assign organisation units and roles, place widgets, save.
Roles define which pages and dashboards a user group sees and what it may do in Node-RED.

Why as a service

Nothing to install

No server, no backups, no updates. New versions reach all customers automatically.

On every device

tusks.io runs in the browser: on the tablet at the line, on the screen in the hall and on the phone.

Works on its own

You can start without machine or ERP integration and record data by hand at first.

Three steps to a running system

  1. Register

    Create your account on setup.tusks.io. The first 30 days are free, with no limits on users or data.

  2. Model your plant

    Enter lines and machines, shifts, workflows and materials. You build dashboards from widgets.

  3. Record data

    Start with manual feedback on the dashboard. Connect machines and your ERP when you are ready.

Pricing

Flat price, regardless of the number of users, workstations and sites. You can try both plans free for 30 days without restrictions. All prices exclude VAT. Questions about the offer go to sales@tillner.ch.

Basic

USD 550

per month, excl. VAT

  • Dashboards
  • Order management
  • Workflows
  • Meters
  • KPIs
  • Shift recording
Try free for 30 days

Advanced

USD 2,650

per month, excl. VAT

Everything in Basic, plus:

  • Test system
  • Snapshots
  • Zone flexibility
  • Custom domain
Try free for 30 days

Get to know tusks.io with your own data

Try it free for 30 days, or let us show you the software in a guided demo.